GOplot包
AI-摘要
海底捞里没有鱼 GPT
AI初始化中...
介绍自己 🙈
生成本文简介 👋
推荐相关文章 📖
前往主页 🏠
前往爱发电购买
GOplot包
泡泡加载数据
1 | # Load the library. ------------------------------------------------------- |
柱状图GObar
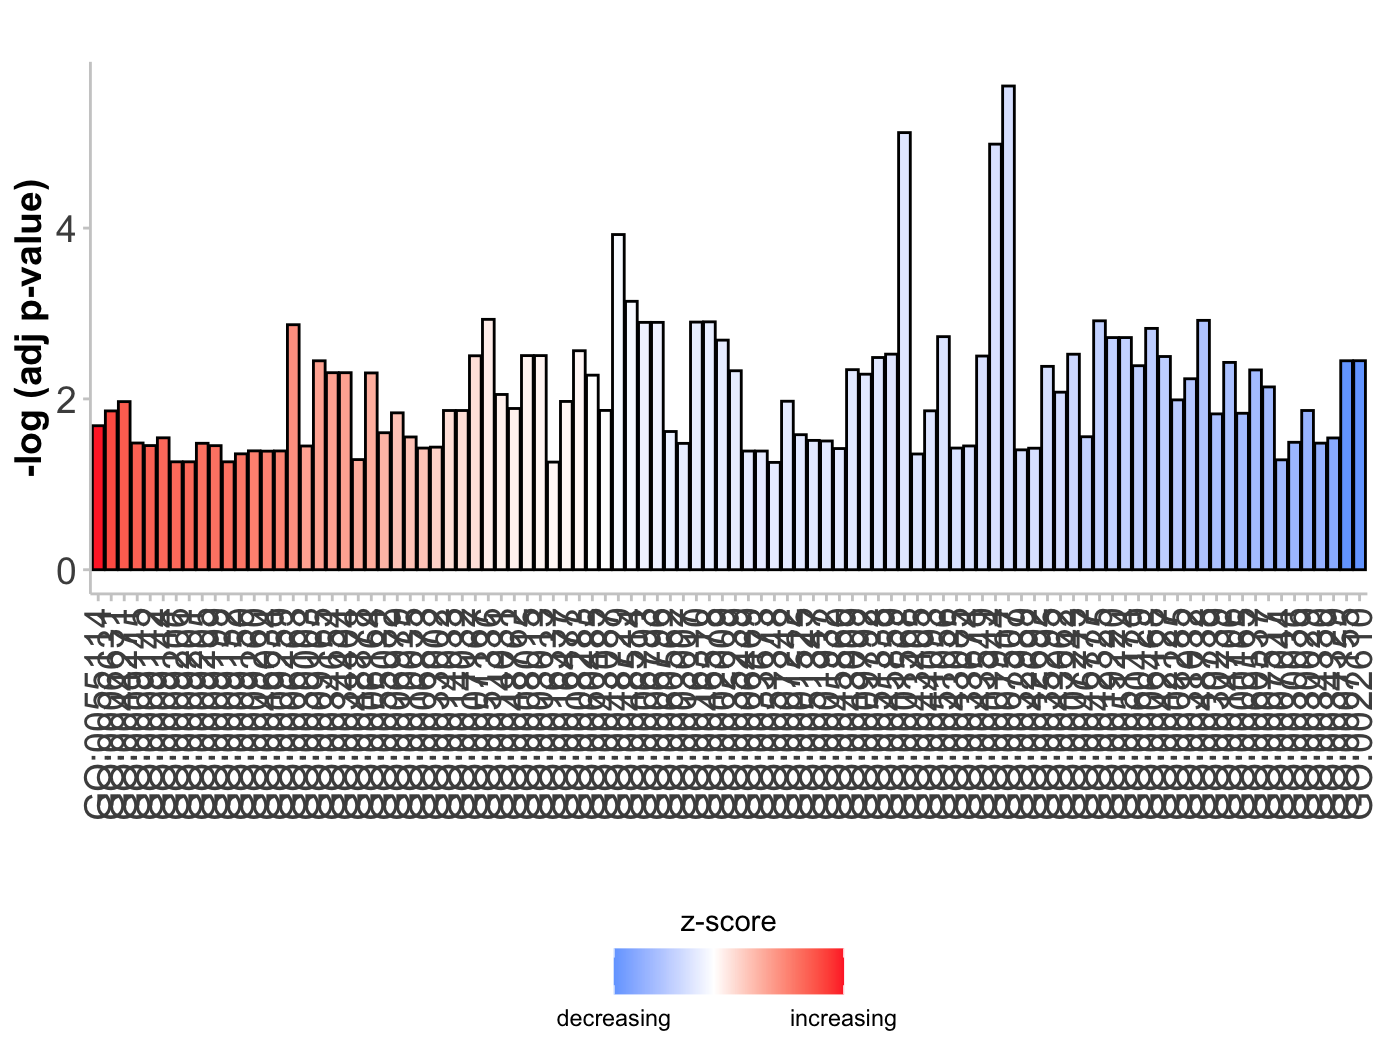
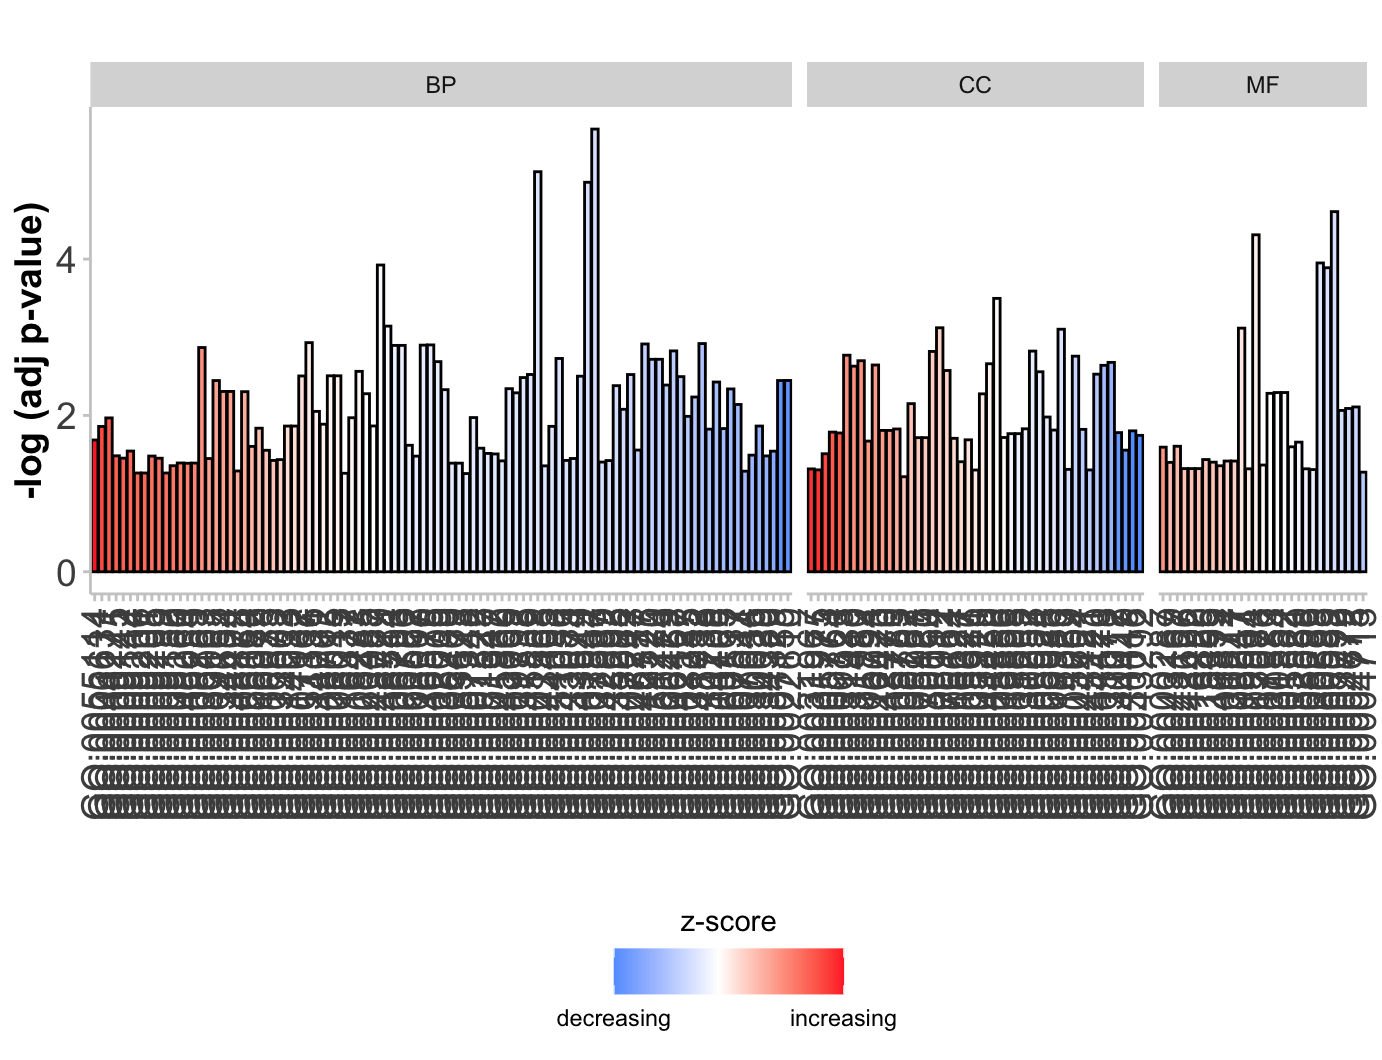
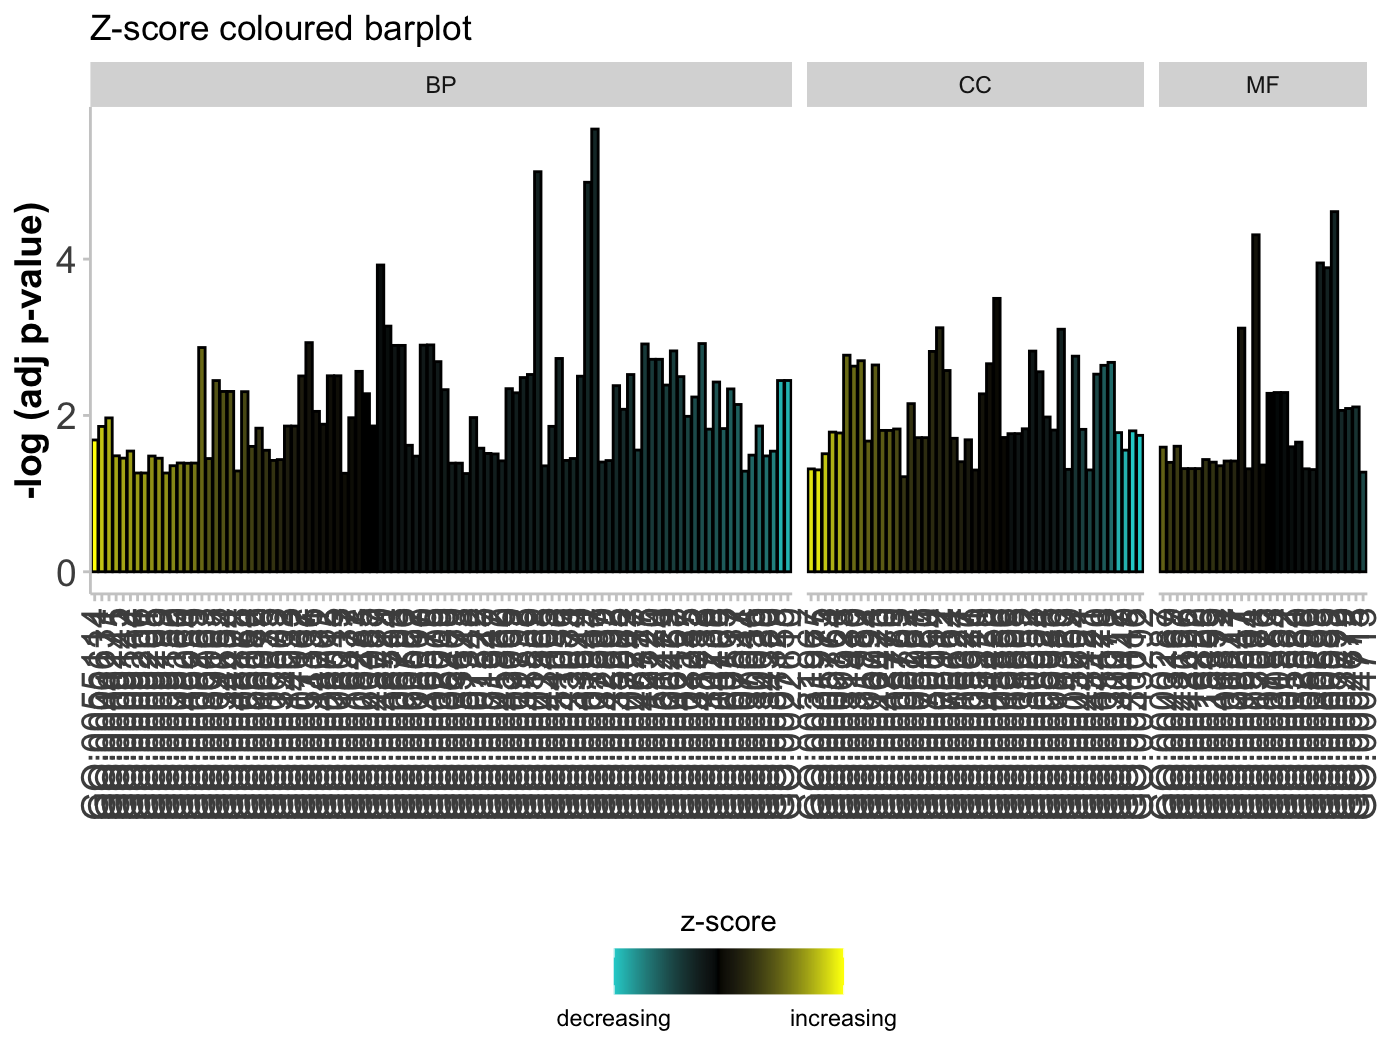
1 | # Barplot ----------------------------------------------------------------- |
气泡图GObubble
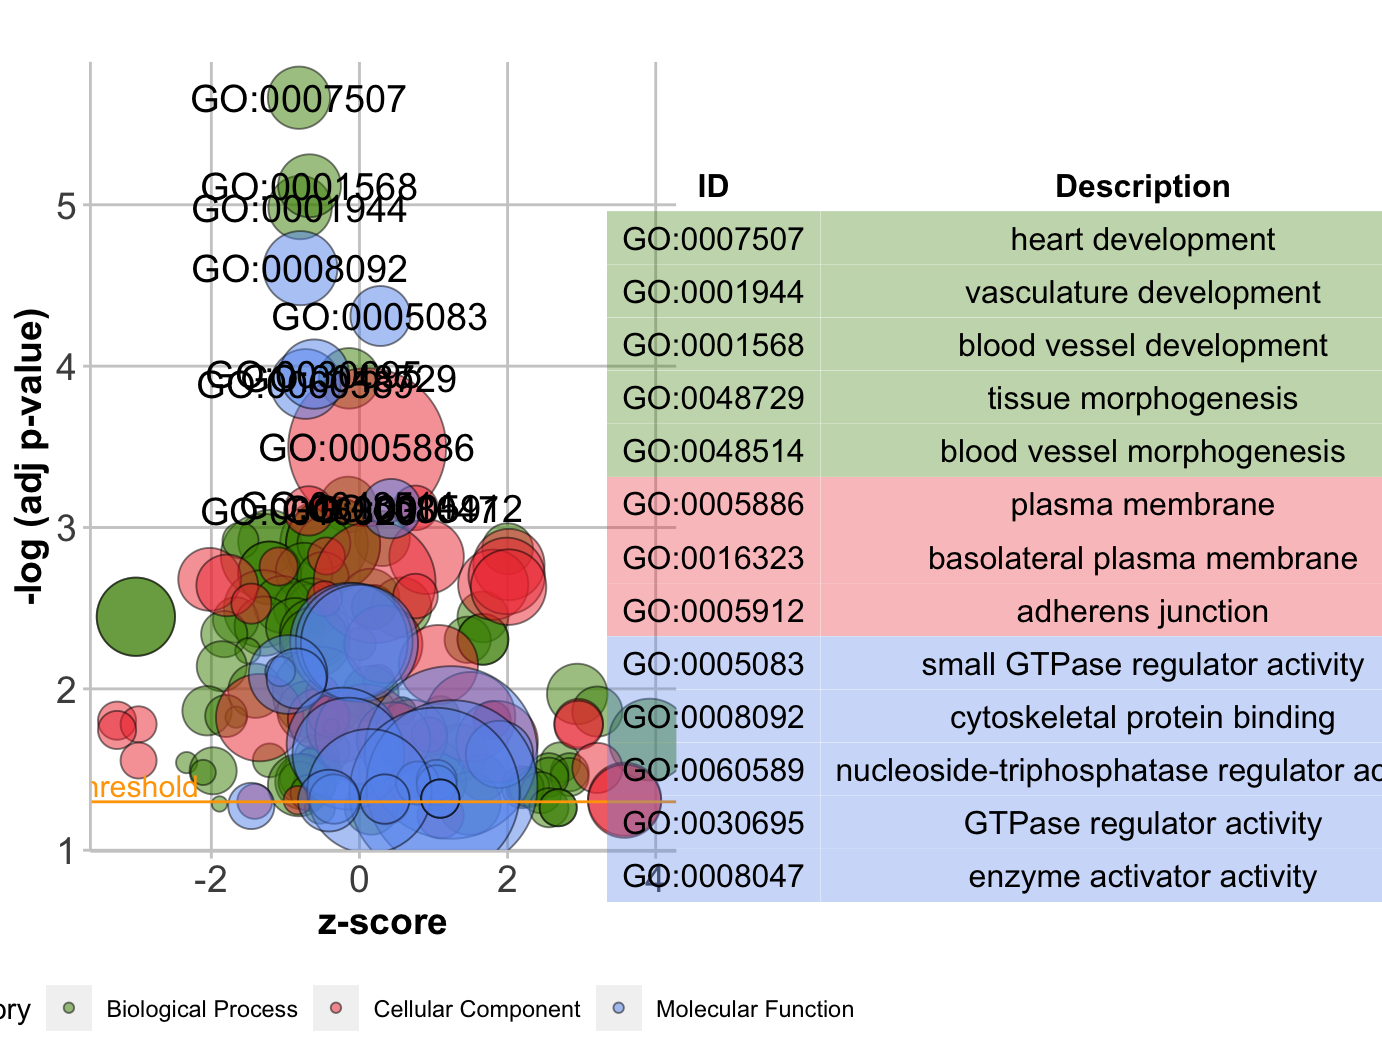

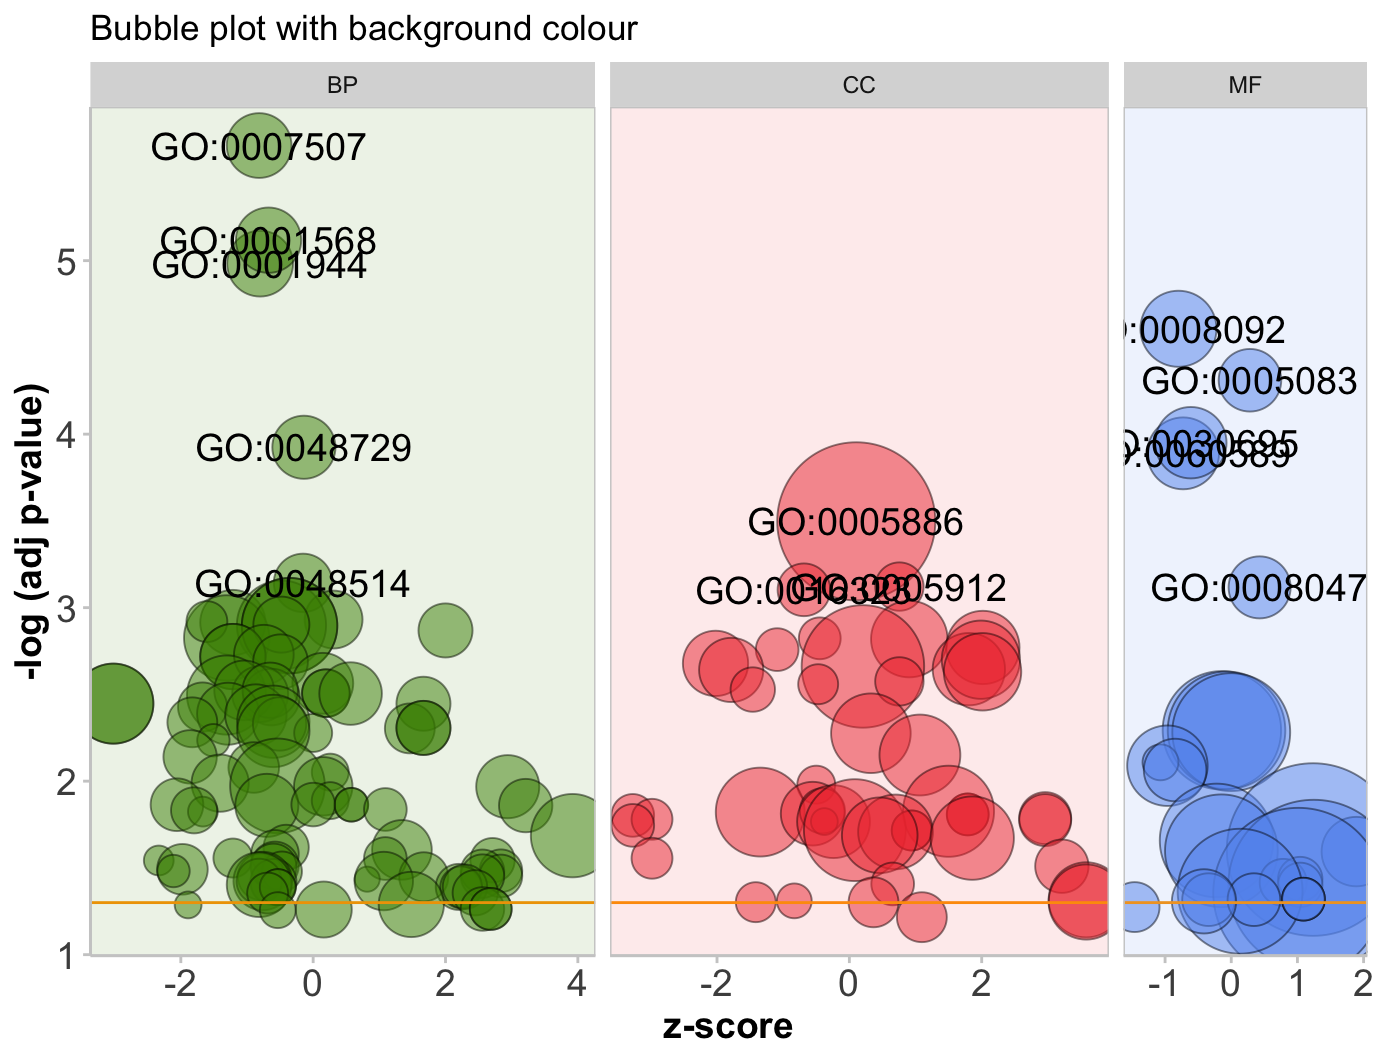
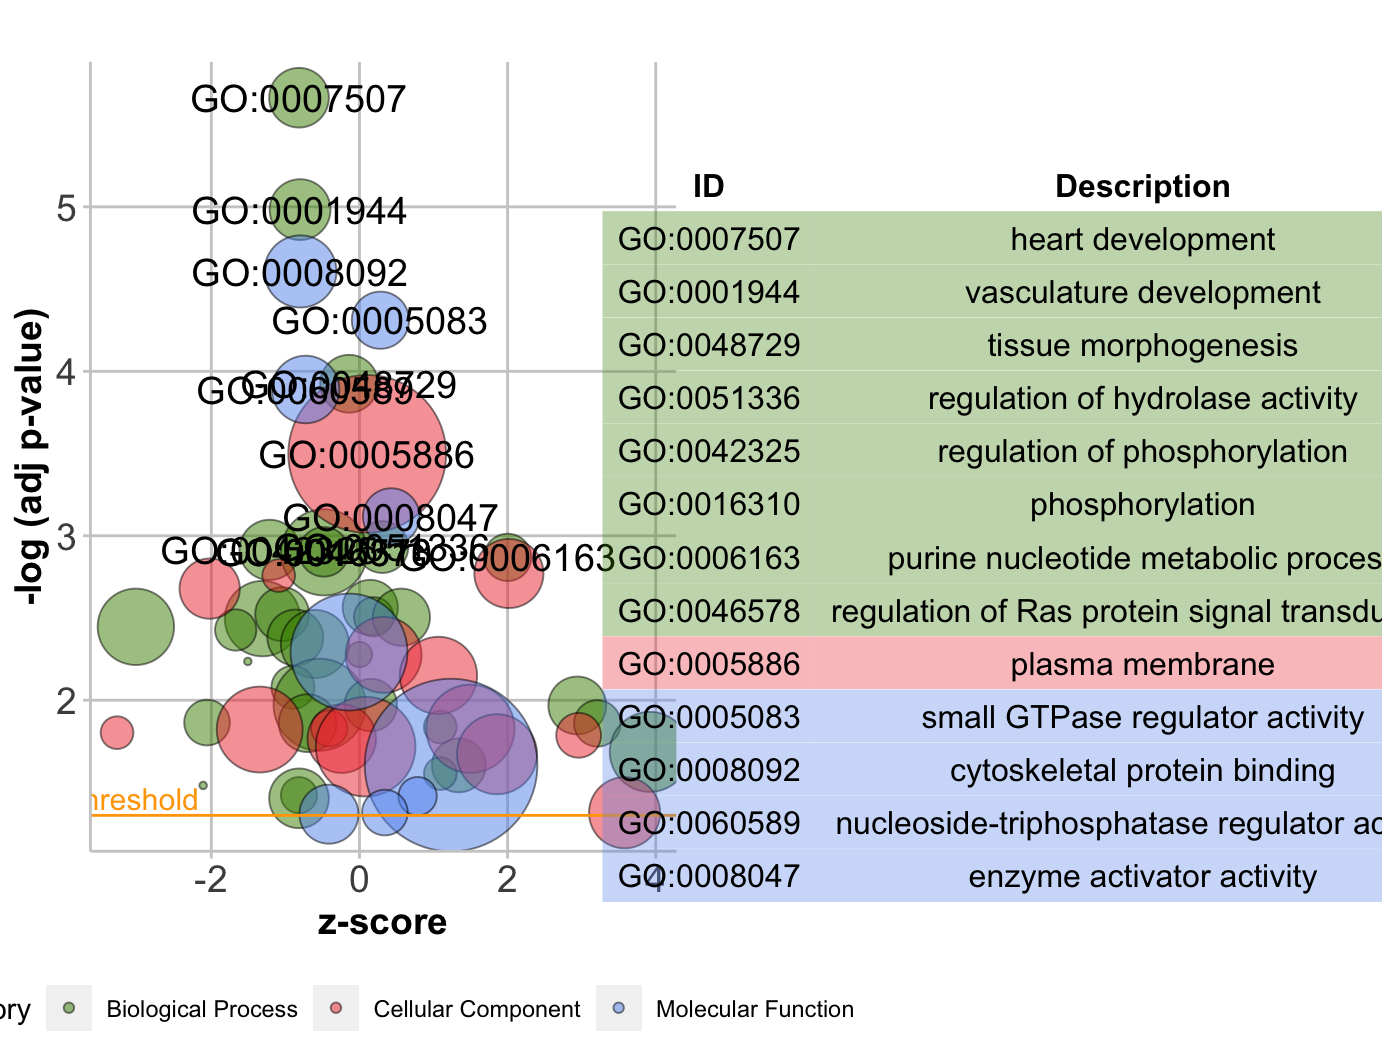
1 | # Bubble plot ------------------------------------------------------------- |
圈图GOCircle
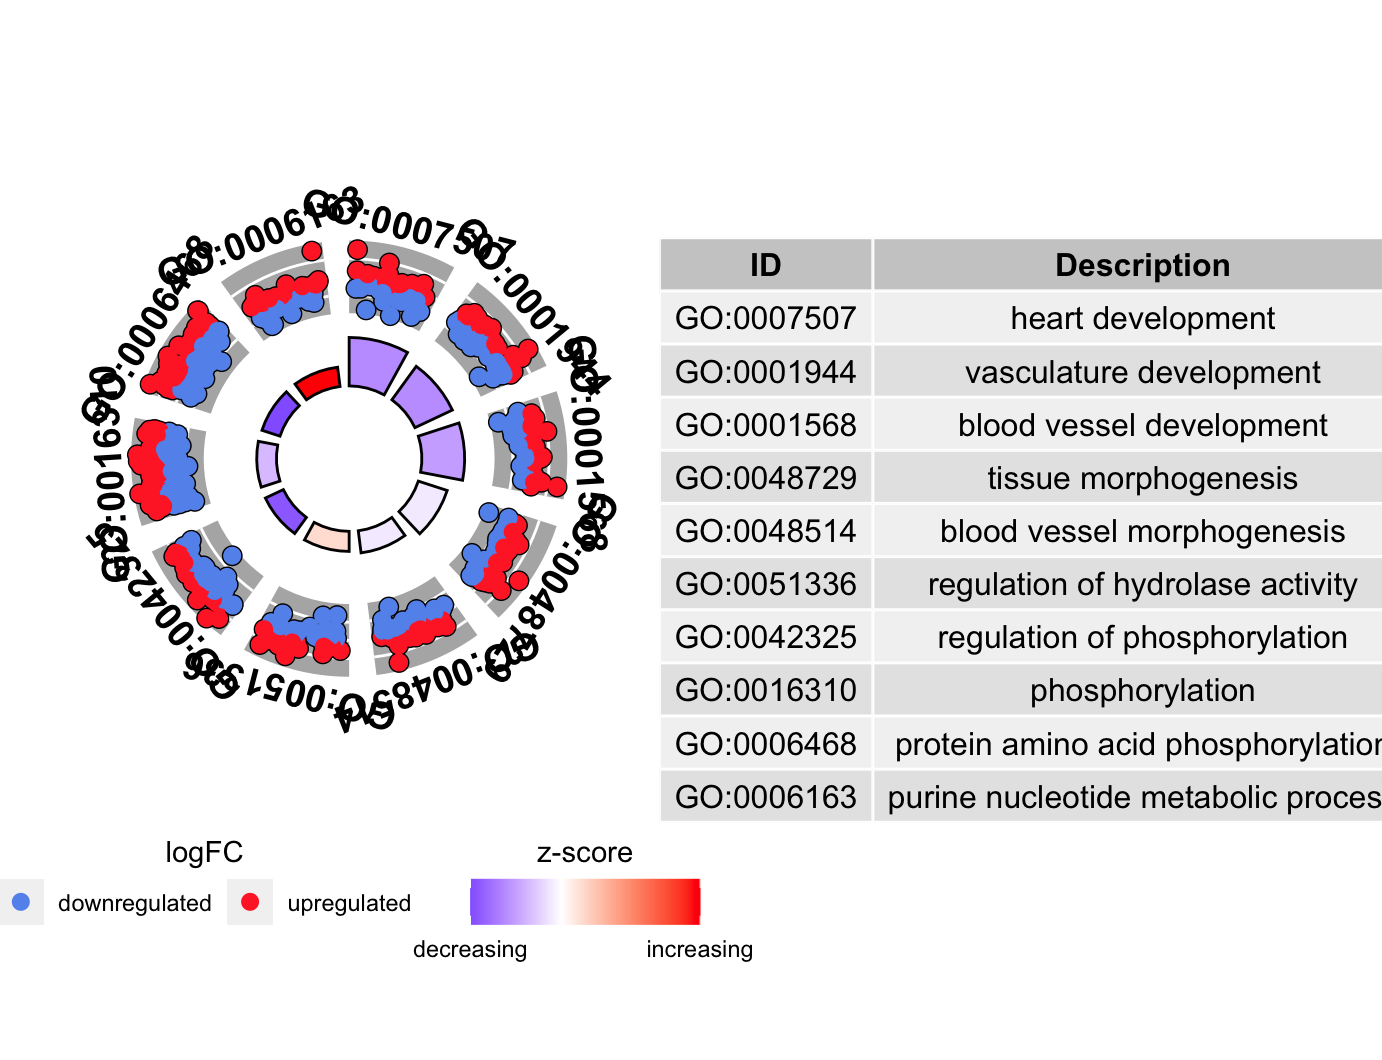
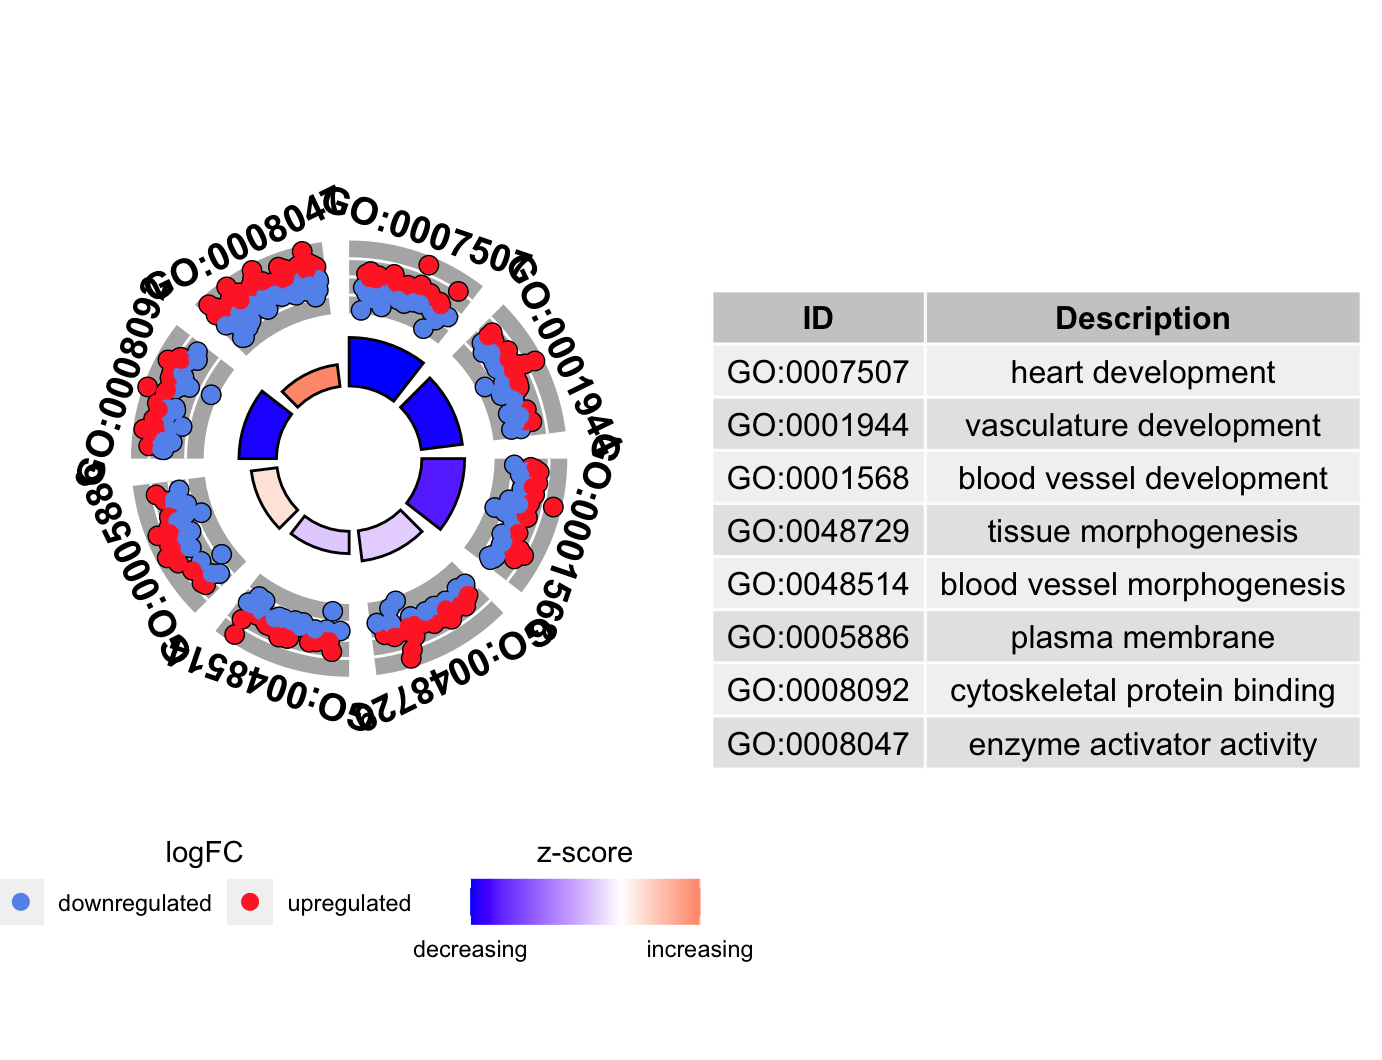
1 | # GOcircle ---------------------------------------------------------------- |
圈图GOChrod
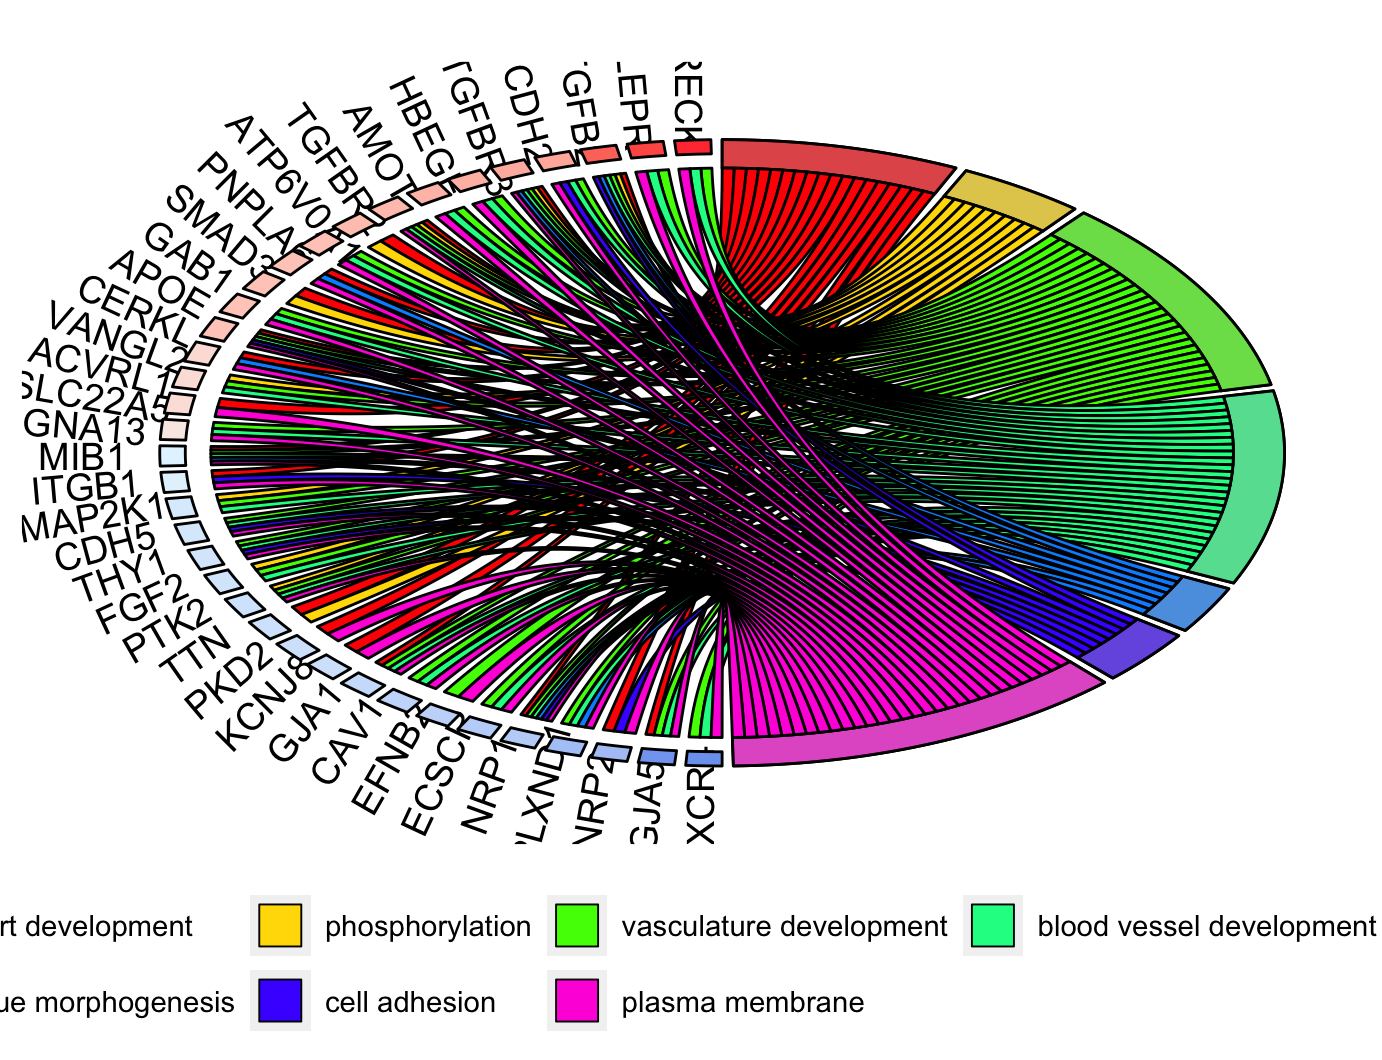
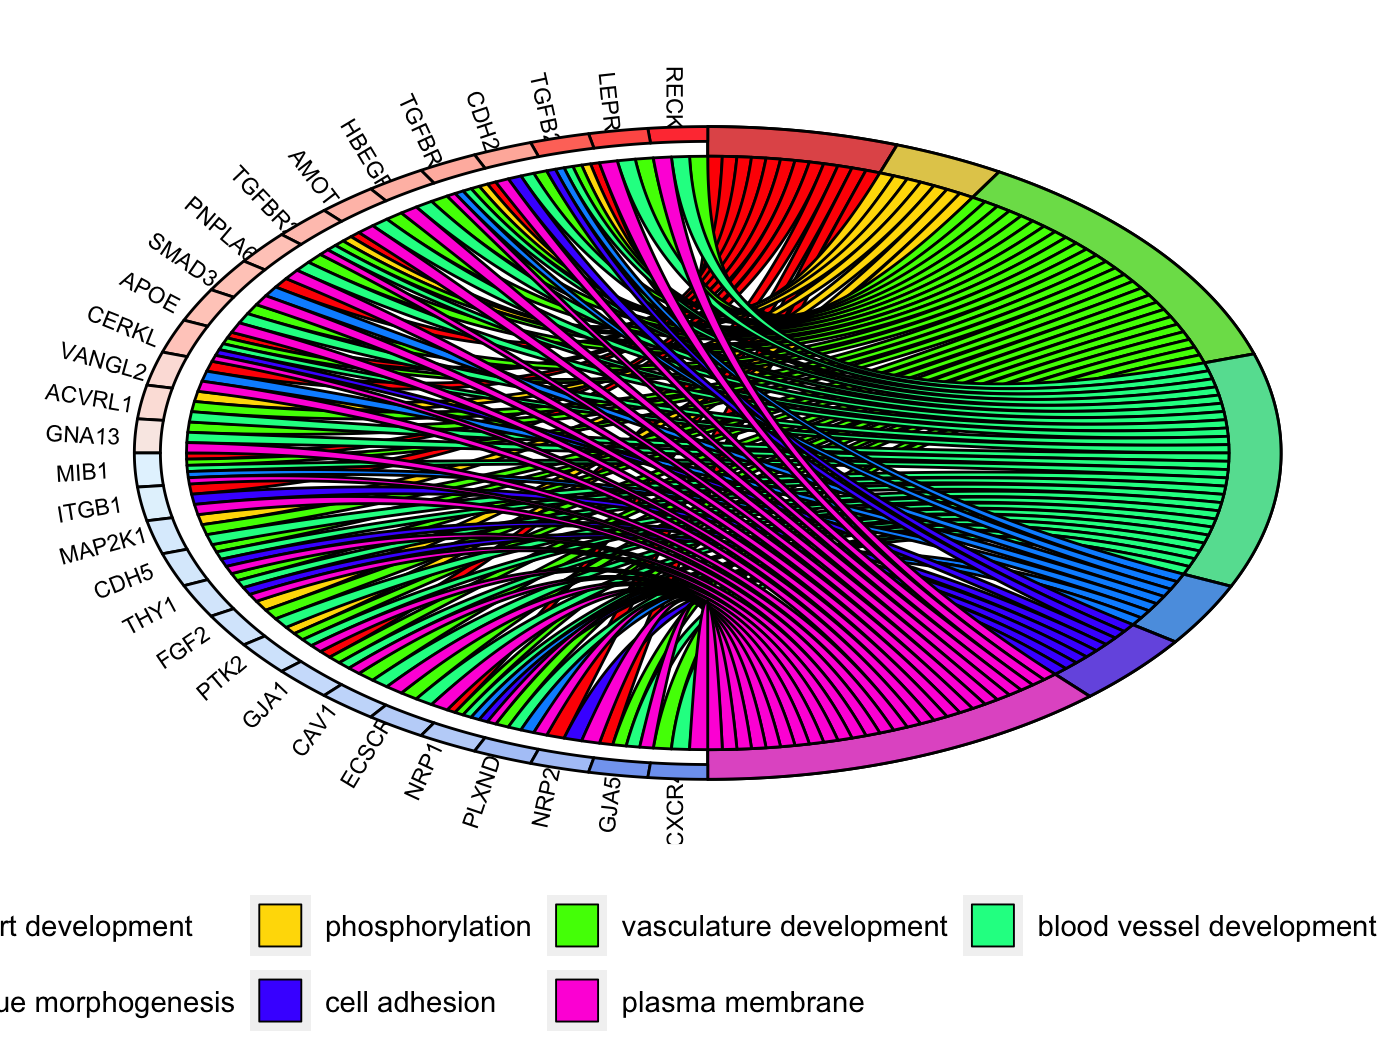
1 | # GOChrod ----------------------------------------------------------------- |
热图GOHeat
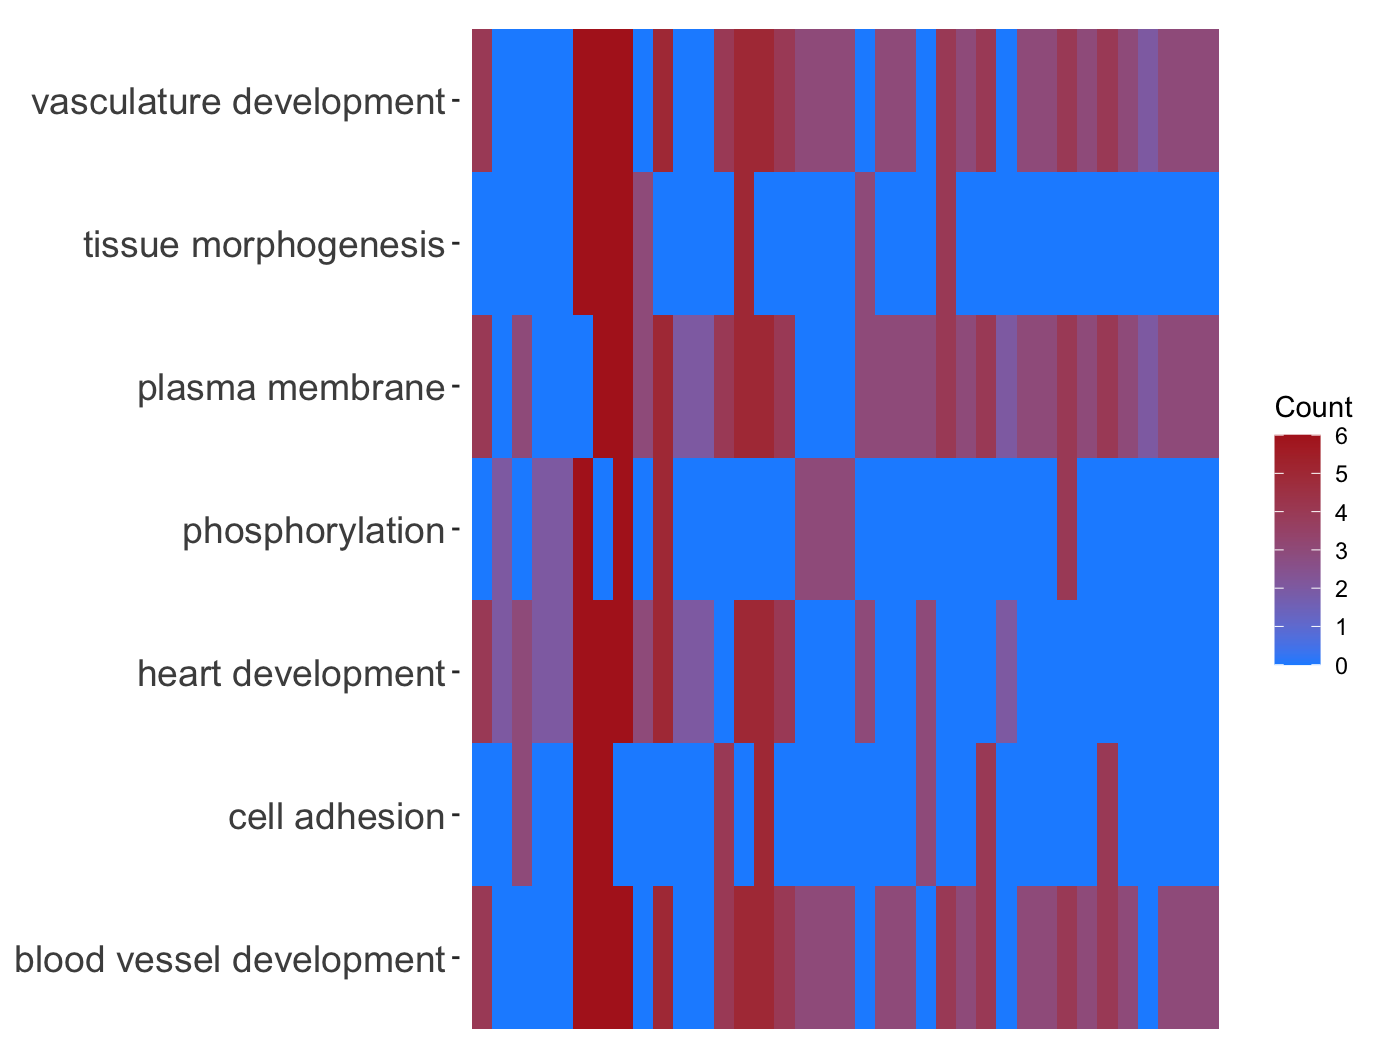

1 | # GOHeat ------------------------------------------------------------------ |
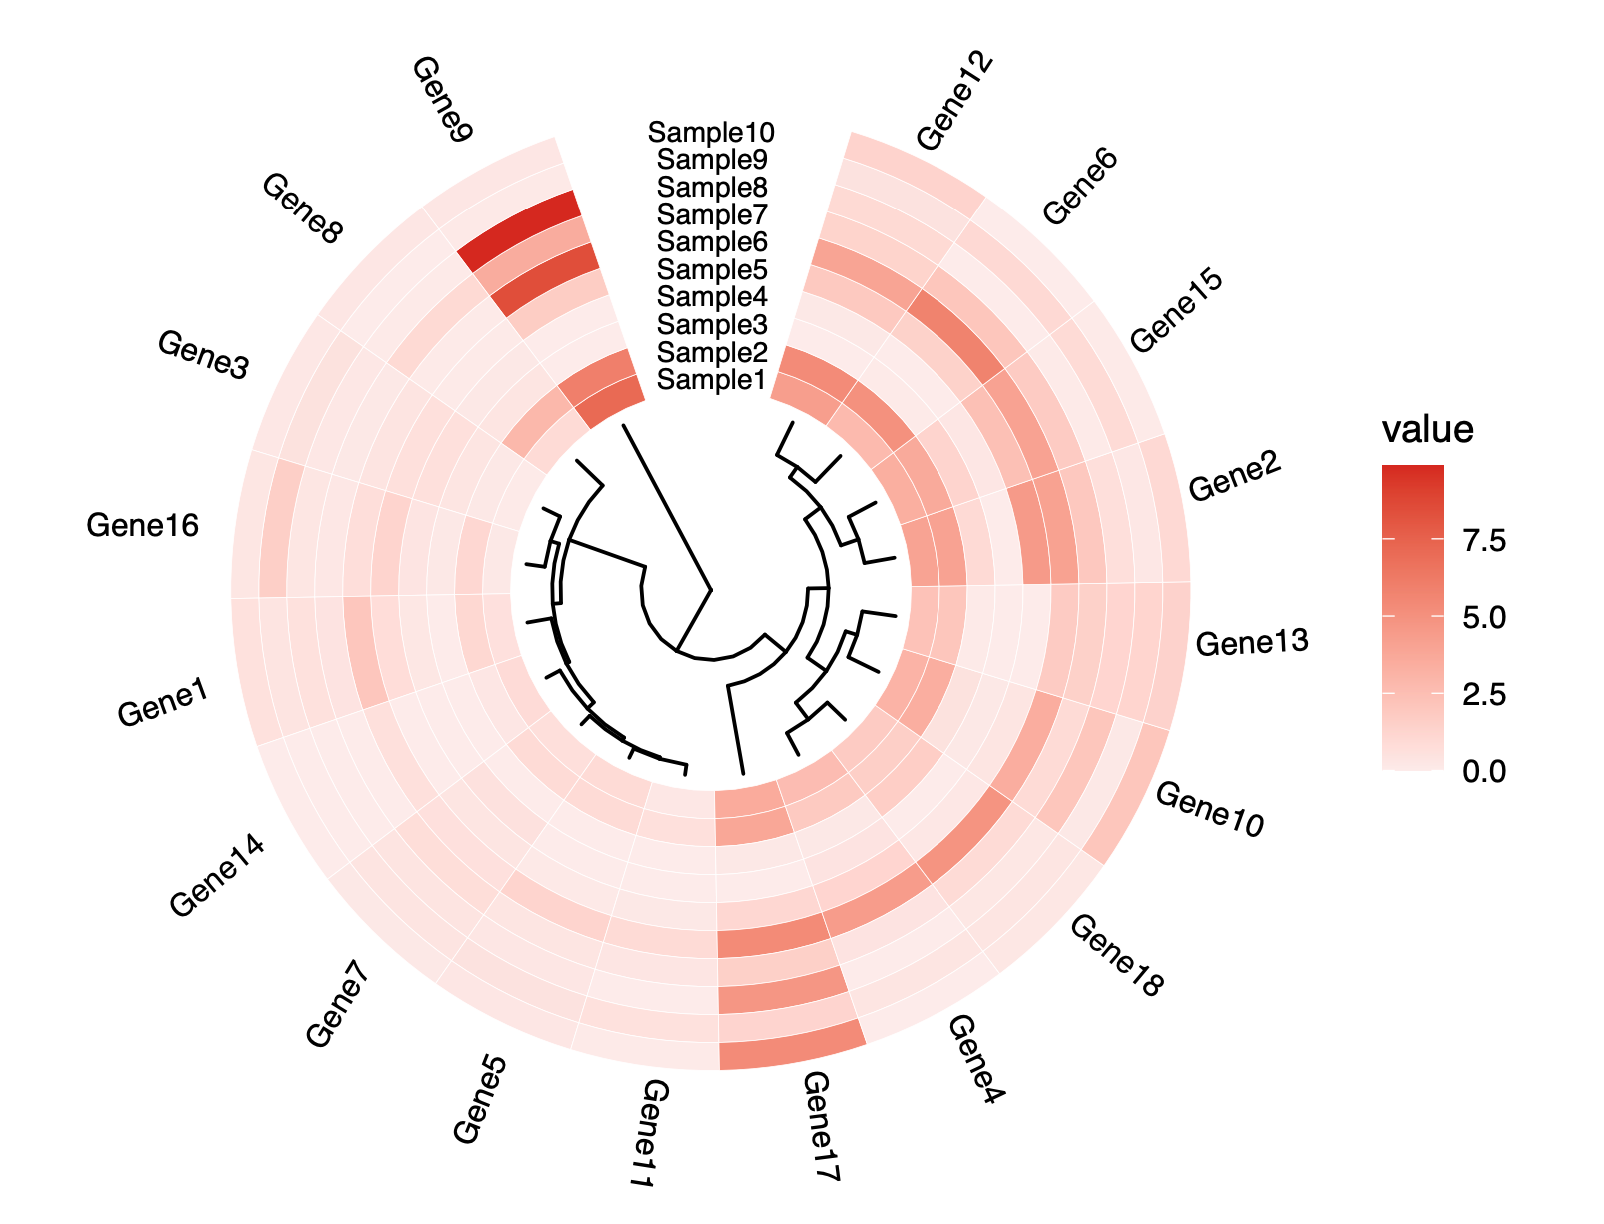
聚类图GOCluster
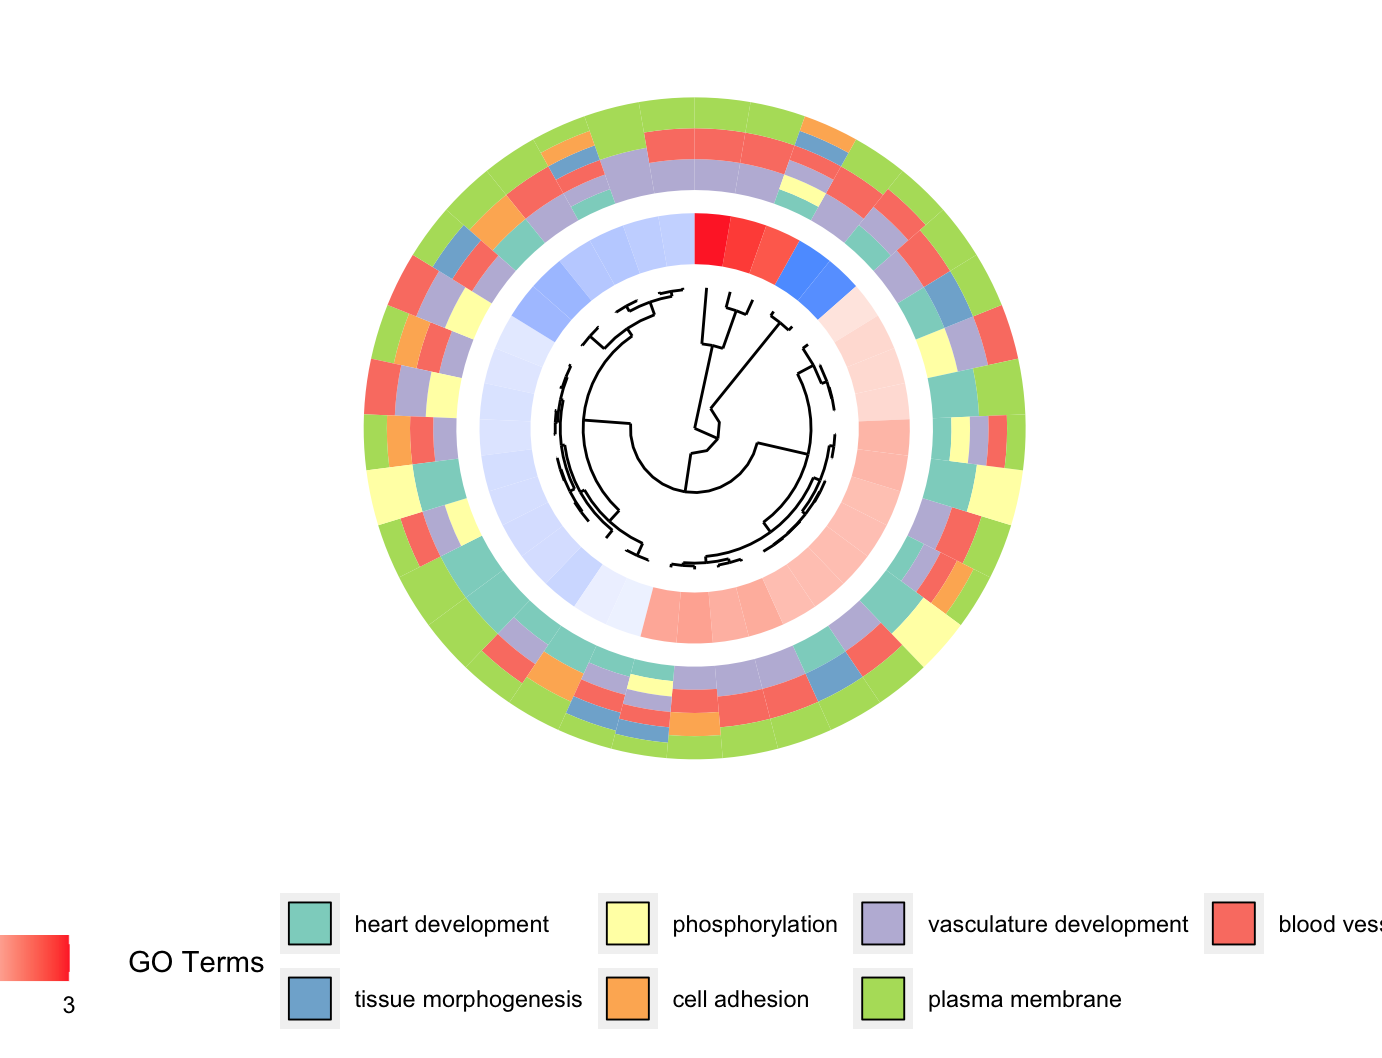
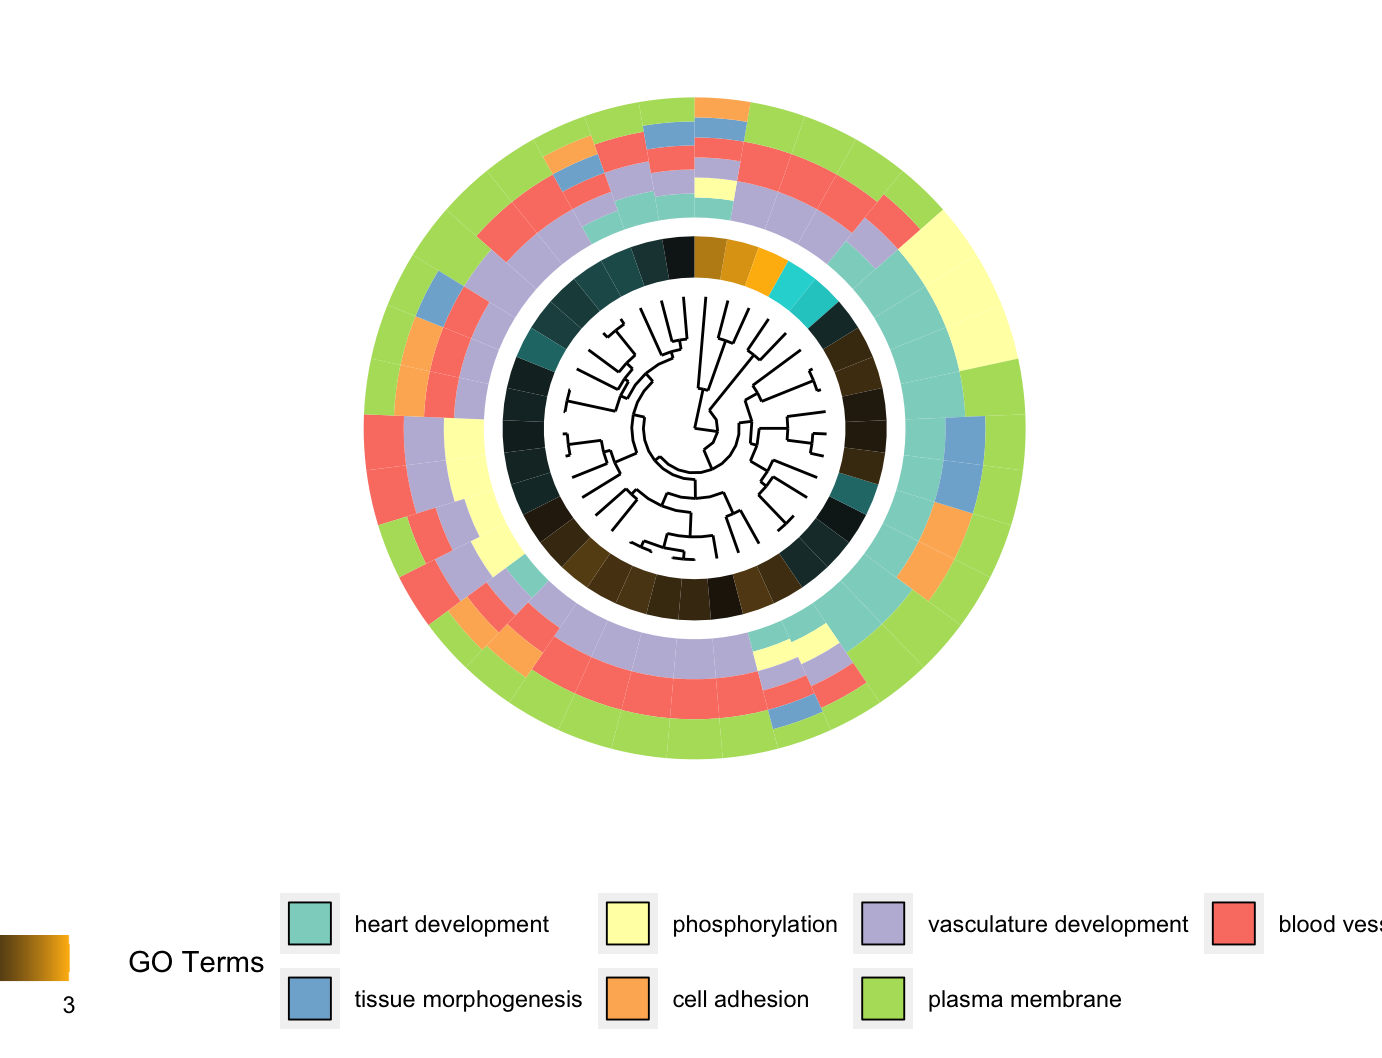
1 | # GOCluster --------------------------------------------------------------- |
Venn图GOVenn
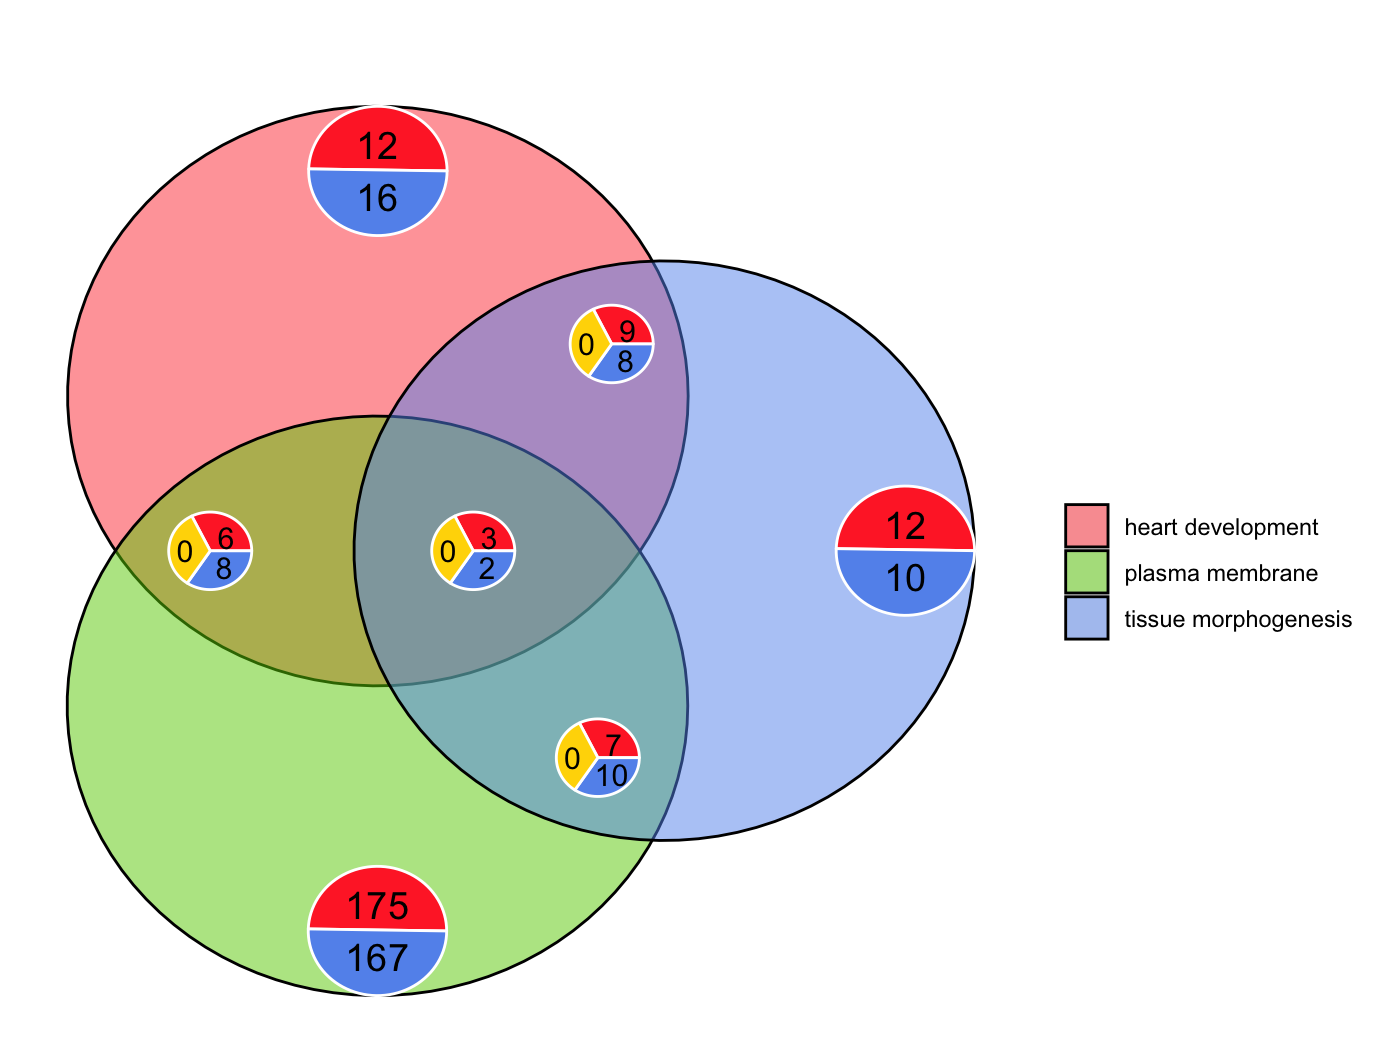
1 | # GOVenn ------------------------------------------------------------------ |
在线作图:VennDiagram

猜你喜欢


评论
匿名评论隐私政策
✅ 你无需删除空行,直接评论以获取最佳展示效果